

Beyond the AI Hype: Analysing Market Valuations and Trump
Today, I will be examining the extent of market overvaluation in the S&P, NASDAQ 100, and the Magnificent 7 amid the AI boom, and what this mean for the future of the market.


The point of my article is basically to show that if multiples contract, the underlying normalized FCF is enough to at least keep a market correction to sub 30% or in some cases just maintain the current stock price until the bear market ends (basically, stagnation).
Disclaimer: This article will get political. If you are a Trump fan that is unable to hold his feelings to himself and think rationally, please leave this article when I get to part II.
Mention: Most numbers from 15-20 March 2025.
I will cover:
I. Overvaluation in terms of Suppressed FCF and the AI investment cycle
II. Trump’s economic policies and their effect on the Market
III. Conclusion
I. Overvaluation in terms of Suppressed FCF and the AI investment cycle
A. Market Overvaluation Analysis: FCF, CapEx, and the AI Investment Cycle
As we move through early 2025, concerns about market overvaluation have started to appear. This analysis examines current market valuation metrics and provides concrete examples of Free Cash Flow (FCF) and Capital Expenditure (CapEx) dynamics among major technology companies, exploring how unprecedented AI investments are affecting valuation.
B. Current Market Valuation Metrics
Current market valuations appear stretched by several traditional metrics, though the impact of massive AI investments requires careful consideration when interpreting these figures. Major technology companies are trading at premium valuations that reflect both their current earnings power and expectations for future AI-driven growth.
The current Shiller P/E Ratio is standing at ~35 and the normal P/E ratio is closer to ~28.2. The current Dividend Yield is 1.32%, and the only other time it was this low was during the Dot-com bubble. I will mostly focus on the first two ratios and I will ignore the third because paying dividends hasn’t been the best way to reward shareholders for quite some time; even Warren Buffet is notably anti-dividends when it comes to paying (although he enjoys receiving them, he still prefers buybacks as a way to rewards shareholders). For those that don’t understand why the dividend yield being low is a problem, I ought to explain it to you.
You can skip this:
Assuming a neutral or favorable fiscal situation in regards to dividends, in normal or undervalued markets, companies usually pay a dividend that sits at 30-60% of OCF/NI and this yield throughout history (1880-2000) has sat on average, in the range of 3 - 5.5% . Now, historically speaking, when markets appreciated so much as to acquire a rich valuation, those div. yields started dropping, because OCF never grows as much as the stock price during bull markets, thus causing a mismatch in valuation; so, in other words, although there is no P/OCF , P/FCF metric for the S&P, dividends can show us how much the OCF is really growing in the S&P, because Cash Flow is the true source of all dividends (If you had looked only at Enron’s NI, you would have missed the underlying fraud). Another point to add is that companies, during bubbles, start to use fancy words to explain why they are not increasing their dividend since they now need to increase CapEx because of some new tech that they need and also, if they don’t acquire companies X,Y and Z, they are going to lose the race. Sounds familiar? (Dot-com, crypto, big data, NFT, AI, etc.)
Basically, dividend yields used to show if the market was becoming overvalued in regards to OCF and if the newest tech bubble in town was starting to transform real cash flow into bullsh*t Investments.
The metrics that I presented earlier, whilst indicating very high overvaluation, must be viewed in the context of unprecedented capital expenditures across the technology sector, which temporarily depress earnings and free cash flow while potentially setting the stage for future growth in some of these stocks when the bubble pops and CapEx margin decreases, giving way to a FCF rebound.
C. CapEx and FCF: Concrete Examples from Tech Giants
To show you what I mean by depressed free cash flows, I will show you a few examples where the FCF yield significantly increases if you calculate the FCF with a normal CapEx (in line with past growth).
C.1. Microsoft - MSFT

Microsoft is making perhaps the most aggressive bet on AI infrastructure among major tech companies. The company plans to allocate approximately $80 billion in fiscal 2025 toward the development of AI-enabled data centers, representing a significant increase in capital expenditure compared to previous years. This investment aligns with analysts' expectations for $84.24 billion in fiscal 2025 CapEx (including capital leases) and marks an estimated 42% year-over-year growth in CapEx. The scale of this investment becomes clearer when noting that Microsoft has already spent $20 billion on CapEx in just Q1 FY2025, indicating an accelerating pace of infrastructure investment.

It is clearly visible that their OCF is growing much slower than their CapEx. This is a problem because if the AI bubble didn’t exist, then their CapEx would probably be closer to $40B (assuming normal growth rates) in 2025, instead of ~$85B. Using the TTM OCF of $125.5B, we get a FCF of $85.5B in a non-Bubble and $45.5B in the current AI Investment boom. The difference is absolutely insane. Even ignoring the possible buybacks or dividends, if we only look at a valuation based on a multiple or DCF we get a totally different situation from today.
25 x Non-Bubble FCF = $2.14T valuation ($278.53/share; ~-28% below current price)
25 x Bubble FCF = $1.14T valuation ($148.05/share;~-62% below current price)
As I pointed out at the start, the valuations are considerably affected by the AI CapEx and if we consider a hypothetical reduction in CapEx to normal levels, this starts to look more and more like 2021, strictly from the tech premium perspective. (Not to mention the fact that 2025 OCF will be higher than TTM for Q2 2025, so the non-bubble premium is closer to ~25%)
C.2. Meta Platforms - META

Meta Platforms is dramatically scaling up its artificial intelligence infrastructure investments, announcing plans to spend between $60-65 billion in capital expenditures for 2025. This represents a stunning ~20% increase from previous guidance and follows an already elevated spending pattern. Prior to the official announcement, market analysts had expected Meta to guide for approximately $52 billion in capital expenditures for 2025, representing a 31% increase from 2024 levels.
This aggressive investment plan centers around constructing massive new data center facilities that CEO Mark Zuckerberg described as potentially covering "a significant part of Manhattan." The infrastructure expansion aims to bring approximately 1 gigawatt of computing power online in 2025, supporting the company's ambitious goal of reaching over 1.3 million GPUs by the end of that year.

In fiscal year 2024, Meta generated $91.3 billion in operating cash flow, yielding an impressive operating cash flow margin of approximately 55.5%. This strong cash generation capability has enabled the company to fund its substantial capital expenditure program while still maintaining healthy free cash flow metrics.
With Meta's planned capital expenditures for 2025 increasing to $60-65 billion (using the midpoint of $62.5 billion), the company's free cash flow generation will face significant pressure despite continued revenue growth. Analysts project Meta's 2025 revenue at $188.48 billion, representing a 14.6% increase from the $164.5 billion achieved in 2024. Looking further ahead, analysts forecast 2026 sales of $214.33 billion, suggesting a next-twelve-months (NTM) revenue run rate of approximately $201.4 billion.
Applying Meta's historical operating cash flow margin of 55.5% to this projected revenue yields an estimated operating cash flow of $104.6 billion for 2025. When subtracting the anticipated $62.5 billion in capital expenditures, Meta's projected free cash flow for 2025 would be approximately $42.1 billion. This represents a 19% decrease from the $52.1 billion generated in 2024, despite the significant revenue growth.
Assuming a more normalized capital expenditure of approximately $35 billion for 2025 (representing moderate growth from 2023's $27 billion), Meta's free cash flow would be approximately $69.6 billion - a full $27.5 billion higher than under the current AI investment scenario.
25 x Non-Bubble FCF = $1.74T valuation ($665.6/share; ~+9.5% above current price)
25 x Bubble FCF = $1.05T valuation ($401.7/share; ~-33.9% below current price)
The difference between these scenarios represents a potential valuation gap of approximately $687.5 billion. With Meta's current market capitalization around $1.7 trillion, at a first glance, it looks like the company is being valued closer to the "non-bubble" scenario, suggesting investors are looking beyond the near-term free cash flow impact of the AI investments and focusing on the potential long-term returns.
You can skip this:
It’s not that they are valued closer to non-bubble, but more that they are actually getting a higher multiple on their FCF because of the bubble itself, which is why they can get the same valuation now with 30% less FCF than in a normal world with normalized FCF. As I have already said, the point of my article is basically to show that if multiples contract, the underlying FCF is enough to at least keep a market correction to sub 30% or in some cases just maintain the current stock price until the bear market ends (basically, stagnation).
C.3. Alphabet - GOOG

Alphabet has announced plans to invest approximately $75 billion in capital expenditures for 2025, dramatically exceeding analyst consensus estimates of $57.9 billion and representing a substantial 43% year-over-year increase from 2024 levels. This aggressive spending plan continues an accelerating capital investment trajectory that began in 2024, when Alphabet increased capital expenditures by nearly 63% to $52.5 billion from $32.3 billion in 2023.
CFO Anat Ashkenazi outlined that the majority of the planned $75 billion expenditure will be directed toward technical infrastructure, specifically servers, data centers, and networking equipment. This substantial investment is front-loaded, with Alphabet expecting to deploy $16-18 billion in just the first quarter of 2025.
Alphabet's substantial capital investments are driven by rapidly increasing demand for AI infrastructure. CEO Sundar Pichai highlighted that Google Cloud customers are now consuming more than eight times the compute capacity they did just 18 months ago, demonstrating the extraordinary growth in AI processing requirements. This demand acceleration necessitates substantial infrastructure expansion to maintain Alphabet's competitive position in the AI landscape.

The projected operating cash flow for 2025, based on financial forecasts, is expected to reach approximately $151.7 billion.
Considering a hypothetical "non-bubble" scenario where capital expenditures grow at historical rates rather than the accelerated pace driven by AI investments, using the 2020-2023 compound annual growth rate of approximately 13.2%, a more normalized capital expenditure level for 2025 might be around $42 billion, significantly below the planned $75 billion.
Under this hypothetical scenario, Alphabet's 2025 free cash flow would be approximately $109.7 billion ($151.7 billion operating cash flow minus $42 billion in normalized capital expenditures), compared to the projected $76.6 billion with the full AI investment plan.
25 x Non-Bubble FCF = $2.74T valuation ($220.1/share; ~+31.3% above current price)
25 x Bubble FCF = $1.92T valuation ($154.3/share; ~-8% below current price)
The difference between these scenarios represents a potential valuation gap of approximately $820 billion. This substantial difference illustrates the significant impact of Alphabet's aggressive capital expenditure strategy on conventional valuation metrics based on near-term free cash flow.
D. Comparison to 2022: A Different Kind of Correction
The market correction of 2022 was primarily driven by the Federal Reserve's aggressive interest rate hiking cycle to combat post-pandemic inflation. While current market valuations in 2025 appear similarly extended, the underlying dynamics are markedly different, suggesting the potential correction may unfold differently as well.
The current Price-to-Free Cash Flow (P/FCF) ratios for many companies, particularly in the technology sector, may appear elevated at first glance. However, when excluding the substantial capital expenditures related to AI development and implementation, these ratios are much closer to 2022 levels. This suggests the underlying profitability of many companies remains strong but is temporarily depressed by significant AI investments that are not yet generating proportionate returns.
Unlike 2022, when rising interest rates compressed valuations across nearly all sectors simultaneously, the current environment may produce a more selective correction. Companies that have made strategic AI investments with clear commercialization pathways may experience less severe corrections as their AI capital expenditures begin transitioning to revenue-generating assets. Conversely, companies that increased AI spending without coherent integration strategies may face more substantial valuation adjustments. Of course, this is hearsay since I have not seen any concrete ROI on AI investments and all companies are getting the same results, so for now all we have to base our assumptions for future prices on is the underlying normalized FCF.
This distinction is crucial for understanding why the projected correction of 25-30% may be less severe than historical precedents. The temporary nature of elevated AI capital expenditures means that as these investments begin to yield returns or as they start to die down, free cash flow metrics should improve substantially for well-positioned companies.
E. The AI Investment Cycle: Winners and Losers
Whether the AI Investment Cycle will truly lead to a technological revolution is not within my ability to say, but as much as I hope that AI will change the world, I still have to be realistic and look at the fact that AI still has a few years to ago until it becomes profitable. OpenAI, the largest player in this space, is said to only become profitable in 2029.
Even if this technology proves revolutionary, the bubble might still pop. If, for example, AI becomes more productive than the average worker in 2029-2030, until then the stock market might still crash because of Trump’s economic policies. In other words, in the short and medium term, there is a risk that the bubble might pop, not necessarily due to its own weight, but due to external pressures from the economy that will spill over into the stock market.
In a hypothetical crash,
The biggest lossers are easy to see:
- $NVDA
- $TSMC
- $MSFT
- OpenAI (not listed)
The biggest Winners:
- $GOOG (they are the clear value play, and value plays always outperform in bear markets)
- undervalued Financials
- current stagnating value plays
Most of the market will drop 20-30% like an average stock market correction. I don’t think there is a systemic problem hidden in the economy like in 2008. (we’ll get to that soon)
II. Trump’s economic policies and their effect on the Market
A. Inflation, GDP, Consumer Sentiment
Several macroeconomic factors are creating a challenging environment that could accelerate a market correction. The Federal Reserve faces a particularly difficult balancing act in 2025, with tensions between its dual mandate of maximum employment and price stability potentially resulting in higher-for-longer interest rates.
GDP - The Trump Problem
Simply put, Trump has managed to speed run a recession, or at least guarantee economic stagnation for 4 years.

The most recent estimate for Q1 from the Federal Reserve Bank of Atlanta is a GDP decline of 2.1% down from an estimated growth rate of 2.3%.
Consumer confidence also dropped sharply in February to 98.3. Moreover, the Present Situation Index, based on consumers’ assessment of current business and labor market conditions, fell 3.4 points to 136.5. The Expectations Index—based on consumers’ short-term outlook for income, business, and labor market conditions— dropped 9.3 points to 72.9. For the first time since June 2024, the Expectations Index was below the threshold of 80 that usually signals a recession ahead.
February’s fall in confidence was shared across all age groups but was deepest for consumers between 35 and 55 years old. The decline was also broad-based among income groups, with the only exceptions among households earning less than $15,000 a year and between $100,000–125,000.
“In February, consumer confidence registered the largest monthly decline since August 2021,” said Stephanie Guichard, Senior Economist, Global Indicators at The Conference Board. “This is the third consecutive month on month decline, bringing the Index to the bottom of the range that has prevailed since 2022. Of the five components of the Index, only consumers’ assessment of present business conditions improved, albeit slightly. Views of current labor market conditions weakened. Consumers became pessimistic about future business conditions and less optimistic about future income. Pessimism about future employment prospects worsened and reached a ten-month high.”
On the fiscal front, the House Republican caucus passed a multi-trillion dollar budget resolution that includes a $4.5 trillion ceiling on the deficit impact of an extension to the Tax Cuts and Jobs Act, $300 billion in additional funding for border security and defense, and a $4 trillion increase in the debt limit. This expansionary fiscal policy at a time when the economy is already operating near full capacity could increase inflationary pressures. I am sure you can imagine how budget cuts that increase the deficit even more are bad for the GDP and the debt sustainability long-term.
B. Tariffs and Uncertainty
Mention: Initially I mentioned specific tariffs, but since Trump is continuously changing them, I have been forced to talk about them in a non-specific manner and I will therefore only mention them without percentages.
Disclaimer
This part of this analysis has a heavy political leaning and I would suggest you don’t read it if you are a Trump fan.
Since Trump came into office, on the 19th of January 2025, he has managed to absolutely destroy the reputation of the US as a reliable trading partner. Although he has been helpful for the EU, to push them out of stagnation.
The Reserve Currency and Tariffs - personal opinion
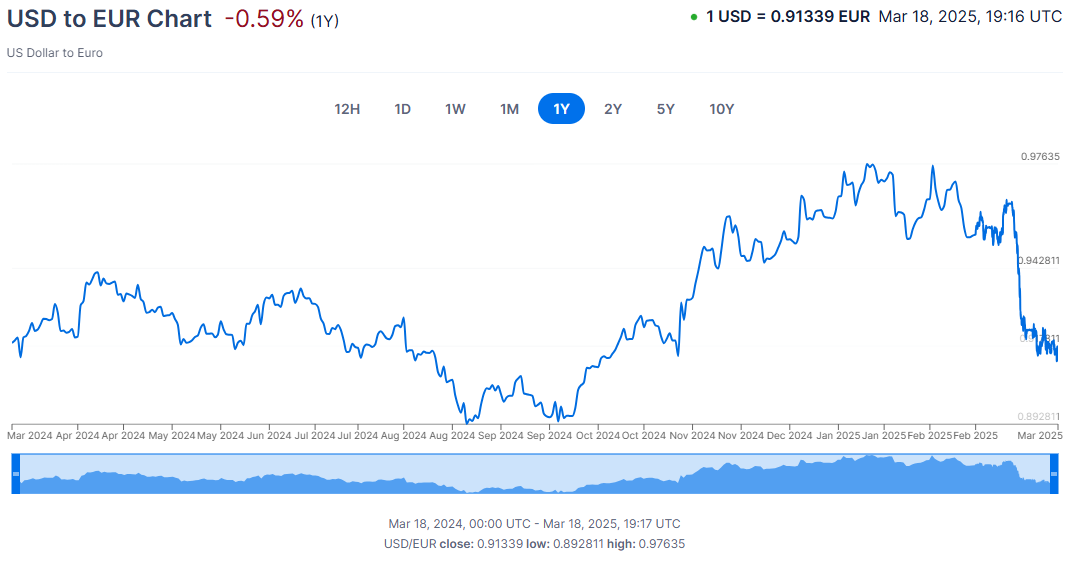
The USD has ALWAYS (past 80 years) captured momentum during crises because people flocked with their capital to the US for stability, BUT now the tariffs have put the stock market in decline, the exchange rate against the Euro is weakening, the GDP is on path to a recession and the republicans are basically going to make the deficit even worse.
Addressing the recent stock market decline, I am inclined to make a different observation than the other market observants. My personal opinion is that capital is slowly being diverted from the US stock market (the divergence in the past weeks between the US and EU markets suggest this), which is further supported by the USD foreign exchange rate. This is dangerous for the USA because its capital markets have always been helped to absorb recessions through increased foreign capital absorption (the fact that they have 200% stock market to GDP valuation or the >50% global should give that away). You don’t get to sell trillions in bonds, overinflated assets (stocks, real estate, start ups) without some foreign capital, the flow of which has been greatly accelerated since the 90s, a fact which has permitted for higher and higher multiples after the turn of the millennium. Without this continuous money pump working, the deficit is not as sustainable. (To all the people that say the US can’t default, I must remind you that all empires have their end and that the US either goes into hyperinflation or they do something similar to a default, because you don’t just bail out a country with Trillions in debt, this is not Greece, this is the USA)
Tariffs Impact - taxfoundation.org estimates
They estimate that the IEEPA and Section 232 tariffs will reduce US GDP by 0.4 percent and hours worked by 309,000 full-time equivalent jobs, before accounting for foreign retaliation.
China, Canada, and the European Union have announced or imposed retaliatory tariffs.
The first Trump administration imposed tariffs on thousands of products valued at approximately $380 billion in 2018 and 2019. The second Trump administration tariffs now affect more than $1 trillion of imports, and when temporary exemptions for Canada and Mexico expire in April, the tariffs will affect more than $1.4 trillion of imports.
The Biden administration kept most of the Trump administration tariffs in place, and in May 2024, announced tariff hikes on an additional $18 billion of Chinese goods, including semiconductors and electric vehicles.
They estimate the 2018-2019 trade war tariffs imposed by Trump and retained by Biden reduce long-run GDP by 0.2 percent, the capital stock by 0.1 percent, and employment by 142,000 full-time equivalent jobs.
Academic and governmental studies find the Trump-Biden tariffs have raised prices and reduced output and employment, producing a net negative impact on the US economy.
Many economists have evaluated the consequences of the trade war tariffs on the American economy, with results suggesting the tariffs have raised prices and lowered economic output and employment since the start of the trade war in 2018.
A February 2018 analysis by economists Kadee Russ and Lydia Cox found that steel‐consuming jobs outnumber steel‐producing jobs 80 to 1, indicating greater job losses from steel tariffs than job gains.
A March 2018 Chicago Booth survey of 43 economic experts revealed that 0 percent thought a US tariff on steel and aluminum would improve Americans’ welfare.
An August 2018 analysis from economists at the Federal Reserve Bank of New York warned the Trump administration’s intent to use tariffs to narrow the trade deficit would reduce imports and US exports, resulting in little to no change in the trade deficit.
A March 2019 National Bureau of Economic Research study conducted by Pablo D. Fajgelbaum and others found that the trade war tariffs did not lower the before-duties import prices of Chinese goods, resulting in US importers taking on the entire burden of import duties in the form of higher after-duty prices.
An April 2019 University of Chicago study conducted by Aaron Flaaen, Ali Hortacsu, and Felix Tintelnot found that after the Trump administration imposed tariffs on washing machines, washer prices increased by $86 per unit and dryer prices increased by $92 per unit, due to package deals, ultimately resulting in an aggregate increase in consumer costs of over $1.5 billion.
An April 2019 research publication from the International Monetary Fund used a range of general equilibrium models to estimate the effects of a 25 percent increase in tariffs on all trade between China and the US, and each model estimated that the higher tariffs would bring both countries significant economic losses.
An October 2019 study by Alberto Cavallo and coauthors found tariffs on imports from China were almost fully passed through to US import prices but only partially to retail consumers, implying some businesses absorbed the higher tariffs, reducing retail margins, instead of passing them on to retail consumers.
In December 2019, Federal Reserve economists Aaron Flaaen and Justin Pierce found a net decrease in manufacturing employment due to the tariffs, suggesting that the benefit of increased production in protected industries was outweighed by the consequences of rising input costs and retaliatory tariffs.
A February 2020 paper from economists Kyle Handley, Fariha Kamal, and Ryan Monarch estimated the 2018–2019 import tariffs were equivalent to a 2 percent tariff on all US exports.
A December 2021 review of the data and methods used to estimate the trade war effects through 2021, by Pablo Fajgelbaum and Amit Khandelwal, concluded that “US consumers of imported goods have borne the brunt of the tariffs through higher prices, and that the trade war has lowered aggregate real income in both the US and China, although not by large magnitudes relative to GDP.”
A January 2022 study from the US Department of Agriculture estimated the direct export losses from the retaliatory tariffs totaled $27 billion from 2018 through the end of 2019.
A May 2023 United States International Trade Commission report from Peter Herman and others found evidence for near complete pass-through of the steel, aluminum, and Chinese tariffs to US prices. It also found an estimated $2.8 billion production increase in industries protected by the steel and aluminum tariffs was met with a $3.4 billion production decrease in downstream industries affected by higher input prices.
A January 2024 International Monetary Fund paper found that unexpected tariff shocks tend to reduce imports more than exports, leading to slight decreases in the trade deficit at the expense of persistent gross domestic product losses—for example, the study estimates reversing the 2018–2019 tariffs would increase US output by 4 percent over three years.
A January 2024 study by David Autor and others concludes that the 2018–2019 tariffs failed to provide economic help to the heartland: import tariffs had “neither a sizable nor significant effect on US employment in regions with newly‐protected sectors” and foreign retaliation “by contrast had clear negative employment impacts, particularly in agriculture.”
C. Conclusion on Trump
It is hard to make a concrete assesment of his policies due to their uncertainty, but in a nation based in stability, order and democracy, such a policy cannot produce any long-term benefits due to its contradictory nature in relation to the founding pillars of continued American prosperity.
It is everyone’s right to have an opinion and I believe that the truth is somewhat subjective, but in the case of Trump, I truly believe that he and his policies will create at least a market stagnation, if not a full on correction.
III. Conclusion
I believe that Trump is going to accelerate the popping of the AI Bubble, but as I have pointed out, this bubble is not as not as big as some seem to believe, and at most we’ll see a 40% drop in Tech Stocks. This may constitute a opportunity for some or a sign of worse things to come for others. I hope the former are right and that this will shape out like 2022, when I managed to find many great opportunities from which I have profited greatly until now.