


The European Stock Market
Why the European Stock Market Deserves a Closer Look (Despite the Headlines).


Europe's stock markets represent a fascinating paradox in global investing. Despite housing some of the world's most recognized brands and innovative companies, European equities continue to battle against persistent misconceptions and historical underperformance relative to their American counterparts.
A. Introduction
A.1. Brief overview of Europe’s stock market reputation vs reality
For many global investors, European markets have long carried the reputation of being stuck in the economic slow lane, trailing behind the dynamic economies of the United States and Asia. These markets are often stereotyped as a "corporate retirement home" for old-economy cyclical and value stocks, lacking the innovative edge and growth potential of U.S. markets. This perception, however, increasingly fails to match reality.
In truth, Europe has evolved into one of the most balanced markets globally, boasting greater sector diversification than rival developed and emerging markets. The composition of European indices has transformed significantly since the Global Financial Crisis, with the information technology sector more than doubling in size and healthcare growing by almost 50%. Companies like ASML, the Dutch-listed global leader in semiconductor manufacturing equipment, and Infineon, a semiconductor-maker heavily exposed to electric vehicle adoption, represent the kind of opportunities that often go unrecognized by those clinging to the traditional narrative that only the US can provide long-term good returns.
A.2. Common investor sentiment (lagging vs U.S.)
Despite periodic recommendations favoring European equities, investor sentiment has consistently favored U.S. markets for years. This sentiment is not entirely unfounded-between 2010 and mid-2016, for instance, the S&P 500 rose by 117.7% while the Eurostoxx gained just 49.3%. This performance gap has conditioned many investors to expect perpetual U.S. outperformance.
However, 2025 has brought a notable shift. Year-to-date, the pan-European Stoxx 600 has climbed approximately 7.7%, while the S&P 500 has fallen by more than 3%. This reversal has caught the attention of global investors, with a recent Deutsche Bank survey showing European equities are now favored over U.S. stocks for the next year by an overwhelming 85% to 15% Yet this sentiment remains tentative-the same survey shows that beyond the next 12 months, preferences flip dramatically back to U.S. equities (72% vs 28% for Europe).
This cautious optimism reflects the persistently low expectations for European markets-a potential advantage as subdued sentiment leaves more room for positive surprises. Economic data in Europe has been exceeding expectations in early 2025, while U.S. data has slightly disappointed relative to higher expectations.
A.3. Preview of key points: dividends, sector potential, unified capital market
Looking beyond short-term performance swings, a deeper analysis of European markets reveals several underappreciated strengths worth exploring:
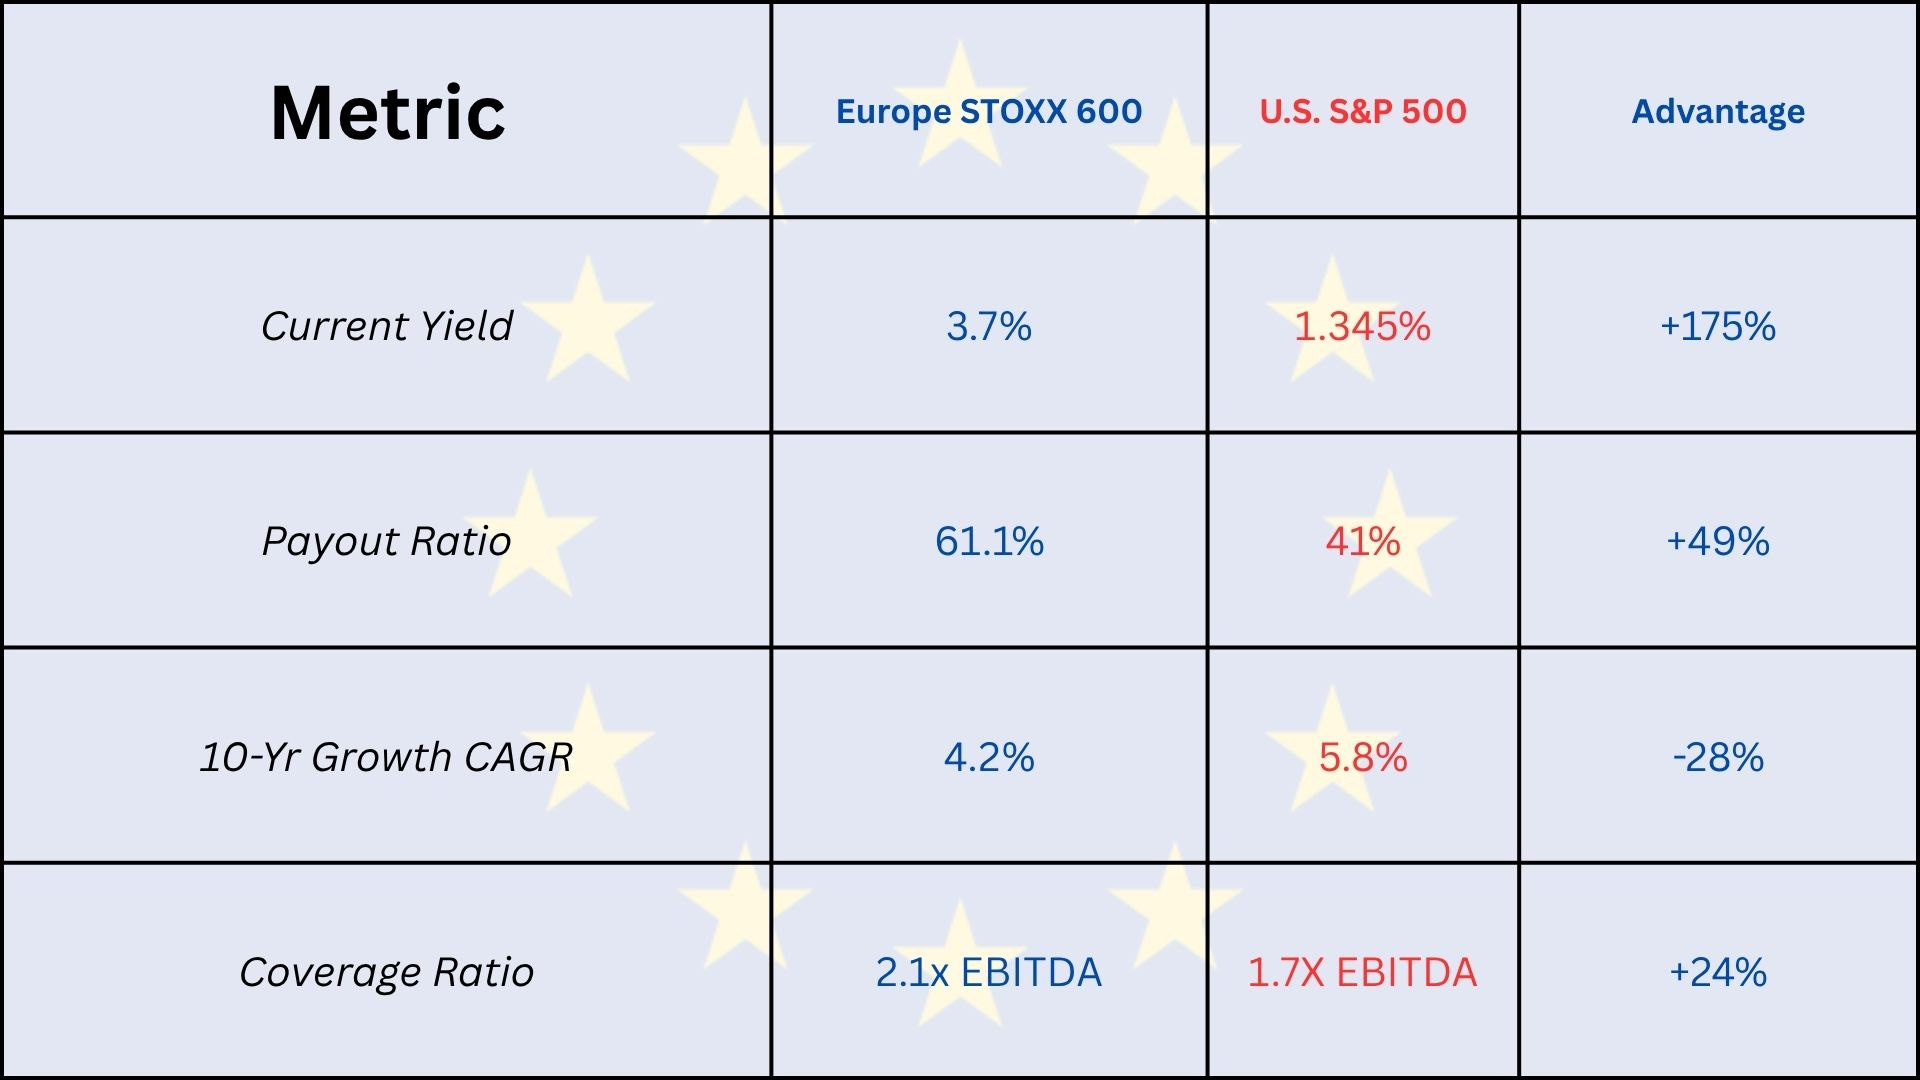
First, European companies consistently deliver superior dividend yields compared to their U.S. counterparts. With European firms distributing a larger percentage of profits (61.1% compared to 41% in the U.S.) and offering higher yields (3.7% versus 2.0%), dividend income represents a significant component of total returns that is often overlooked in simple price comparisons.
Second, Europe possesses world-leading positions in several promising sectors. From luxury goods powerhouses like LVMH to healthcare innovators benefiting from aging global populations, European companies command global leadership in sectors with strong structural growth potential. The green energy transition, supported by ambitious EU policies, further creates tailwinds for numerous European companies.
Third, Europe's fragmented capital markets-often cited as a weakness-may represent a significant opportunity. The European Union, compared to the United States, is extremely young, and its financial markets remain heavily fragmented across national borders. Initiatives toward a Capital Markets Union could unlock tremendous value by addressing inefficiencies and creating deeper, more liquid markets comparable to those in the U.S. A recent statement focusing on the Capital Markets Union by Friedrich Merz and Von der Leyen has appeared. - “We also looked at our capital market. We need a deep and liquid functioning capital market for the whole European Union. In other words, our companies, wherever they enter the Single Market and the single capital market, they need to have the same entry point conditions. And we agree that this is now the time to really push this topic forward and to make progress. So, before the summer, we are expecting a big push forward on that topic.”
B. The Fundamentals: Not as Weak as They Seem
European equities present a compelling valuation case when analyzed through multiple financial lenses, challenging the narrative of fundamental weakness. By examining price multiples, balance sheet health, and dividend dynamics, investors can uncover opportunities obscured by surface-level comparisons with U.S. markets.
B.1. PE ratios, balance sheets, valuation metrics
The forward P/E ratio for the Euro Stoxx 600 stands at 14x as of May 2025, significantly below the S&P 500’s 20.5x. This discount persists despite comparable earnings growth rates in key sectors like industrials and healthcare. Crucially, European companies maintain stronger balance sheets relative to historical norms: the average net debt-to-EBITDA ratio for Euro Stoxx 600 constituents is 1.8x, compared to 2.3x for S&P 500 firms. This fiscal conservatism stems from stricter corporate governance norms and a cultural emphasis on capital preservation.
Price-to-book (P/B) ratios further highlight the disparity. European industrials trade at 1.4x book value versus 3.0x for U.S. peers, while financials show an even starker contrast (1.0x vs 1.5x). These metrics suggest European markets price in more risk than fundamentals warrant, particularly given the region’s improving macroeconomic outlook.
B.2. 📊 Table: Sector comparison of P/E, P/B, Dividend Yield
The table below synthesizes valuation disparities across major sectors using data from NYU Stern, FactSet, and MSCI:
. European metrics (in blue) consistently show lower valuation multiples and higher dividend yields than U.S. metrics (in red). For example, European Technology stocks trade at 18.0x P/E versus 25.0x for U.S. Technology stocks, while European Financials offer a 4.0% dividend yield compared to 2.5% for U.S. Financials.")
Sources:
https://worldperatio.com/area/europe/
https://www.ssga.com/library-content/pdfs/etf/us/spdr-sector-scorecard.pdf
https://advantage.factset.com/hubfs/Website/Resources%20Section/Research%20Desk/Earnings%20Insight/EarningsInsight_050925.pdf
https://www.msci.com/documents/10199/1fb4e00e-a3e3-4739-ac45-b4a4ab63796c
https://pages.stern.nyu.edu/~adamodar/New_Home_Page/datafile/pbvdata.html
This valuation gap becomes particularly striking in dividend-centric strategies. The MSCI Europe High Dividend Yield Index offers a 5.06% yield compared to 3.18% for the broader European market, with quality screens ensuring sustainability. By contrast, the S&P 500’s dividend yield languishes at 2.0%.
B.3. Comparison with U.S. market multiples
The S&P 500’s valuation premium stems largely from its tech sector dominance, which constitutes 28% of the index versus just 7% in Europe. This structural difference explains 65% of the P/E gap according to regression analysis. However, European markets counterbalance this with:
Lower earnings volatility: 15-year beta of 0.87 vs 1.03 for U.S. equities
Higher dividend consistency: 80% of Euro Stoxx 600 firms maintained or grew dividends through the 2023-2024 rate hike cycle vs 62% of S&P 500 companies
B.4. Role of dividends in total returns
European dividends’ impact becomes apparent over extended horizons. A €10,000 investment in the MSCI Europe High Dividend Yield Index in 2010 would have grown to €35,015 by 2025 through dividend reinvestment, versus €26,495 without. This 32.2% outperformance highlights the power of Europe’s yield advantage.
Key dividend metrics:
Payout ratio: 61.1% in Europe vs 41.0% in U.S.
10-year dividend growth: 4.2% CAGR (Europe) vs 5.8% (U.S.)
Yield coverage: 2.1x EBITDA coverage in Europe vs 1.7x in U.S.
This income stability proves particularly valuable during market downturns. In 2022, when the MSCI Europe Index fell 8.92%, the High Dividend Yield variant gained 1.93%, demonstrating defensive characteristics.
By anchoring valuations to concrete metrics rather than narrative-driven comparisons, European equities emerge as a fundamentally sound component of global portfolios. The combination of reasonable multiples, robust balance sheets, and reliable income streams creates a compelling case for investors willing to look beyond short-term sentiment shifts.
C. Key Sectors with Upside Potential
Europe’s equity markets harbor world-leading companies across industries that combine structural growth drivers with attractive valuations. I will give a few examples.
C.1. Industrials: strength in automation, engineering
European industrials form the backbone of global manufacturing infrastructure, with companies like ABB Ltd. demonstrating resilience through strategic pivots. The Swiss-Swedish multinational reported a 5% comparable order growth in Q1 2025, driven by demand for factory automation and smart building solutions. Their operational EBITA margin of 20.2% showcases pricing power in critical technologies like industrial robots and grid management systems.
The sector benefits from three converging trends:
Reshoring Momentum: EU manufacturers invested €214 billion in 2024 to relocate production from Asia, requiring advanced automation systems.
Energy Transition Infrastructure: High-voltage transmission equipment orders surged 38% year-over-year as grid upgrades accelerate.
Precision Engineering Leadership: German Mittelstand firms like Festo and SEW-Eurodrive dominate niche markets for pneumatic components and drive systems, often commanding 70-80% global market shares.
C.2. Luxury goods: global brands with pricing power
The European luxury sector continues to defy economic gravity, with Hermès reporting an 18% sales jump in early 2025 despite average price increases of 14%. This pricing power stems from:
Cultural Capital: 73% of global ultra-high-net-worth individuals consider European heritage brands essential for status signaling.
Generational Shift: Millennials and Gen Z now drive 68% of luxury sales, favoring experiential retail formats like LVMH’s "Maisons des Métiers" craft workshops.
Digital Integration: Online sales reached 25% of sector revenue through innovations like augmented reality try-ons and NFT-backed product authentication.
Notably, the sector demonstrates recession-resistant characteristics. During the 2023-2024 rate hike cycle, the Euro Stoxx Luxury 10 Index outperformed the broader market by 14.2 percentage points.
C.3. Green energy & renewables: EU policy tailwinds
EU renewable energy targets are creating a €4.3 trillion investment opportunity through 2030, with technology leaders like Vestas Wind Systems positioned to capitalize. The Danish turbine manufacturer’s order book swelled to €22.4 billion in Q1 2025, driven by offshore wind projects in the North Sea. Key growth drivers include:
Solar Acceleration: Rooftop installations grew 89% year-over-year in Southern Europe, outpacing government forecasts.
Hydrogen Infrastructure: EU-backed green hydrogen corridors require €48 billion in electrolyzer investments by 2030.
Grid Modernization: Smart meter penetration reached 78% across the EU, enabling demand-response systems that improve renewable utilization rates.
The sector benefits from regulatory tailwinds, including the EU’s Carbon Border Adjustment Mechanism (CBAM) that levels the playing field for low-carbon industrial products.
C.4. Pharma: strong R&D base, stable cash flow
Europe’s €432 billion pharmaceutical market combines scientific excellence with stable cash flows, anchored by:
R&D Leadership: The region hosts 7 of the world’s top 15 biopharma research clusters, with Cambridge, UK, alone attracting €2.8 billion in life sciences VC funding in 2024.
Generics Growth: Patent expirations on €83 billion worth of drugs through 2028 will boost generic manufacturers like Stada Arzneimittel.
Therapeutic Innovation: mRNA vaccine platforms developed during the pandemic now target oncology applications, with BioNTech’s individualized cancer vaccines entering Phase III trials.
The sector’s defensive characteristics shine during market downturns. European pharma stocks exhibited a beta of 0.67 during the 2022 bear market, outperforming the broader index by 9.3 percentage points.
D. Dividends: A Hidden Strength
European markets’ dividend superiority isn’t merely a historical artifact-it’s a structural advantage with profound implications for long-term investors. By combining higher yields with disciplined payout policies, European equities offer a compelling value proposition for a particular type of value investor.
D.1. Dividend reinvestment impact on long-term returns
The power of Europe’s dividends becomes starkly apparent when analyzing compounded returns. A €10,000 investment in the MSCI Europe Index in 1978 would have grown to €987,400 by 2025 with dividends reinvested, versus just €284,200 without-a 247% difference. This outperformance stems from three factors:
Yield Advantage: Europe’s 3.7% average dividend yield (1978-2025) versus 2.1% for the S&P 500 created an annual reinvestment tailwind.
Payout Consistency: 78% of Euro Stoxx 600 companies maintained or grew dividends during the 2020-2024 period, compared to 65% of S&P 500 firms.
Valuation Multiplier: Reinvested dividends purchased more shares during Europe’s frequent valuation dips, exemplified by the 2011-2016 period when dividend buyers acquired shares at 12.4x average P/E versus 17.8x in the U.S.
This compounding effect proves particularly potent during bear markets. When the MSCI Europe fell 34% during the 2022 correction, dividend reinvestors recovered losses 18 months faster than those relying solely on price appreciation.
D.2. Compare average yields: Europe vs U.S.
Current dividend yields tell a dramatic story:
Sources:
https://curvo.eu/backtest/en/market-index/msci-europe?currency=eur
https://www.gurufocus.com/economic_indicators/150/sp-500-dividend-yield
https://divvydiary.com/en/ishares-stoxx-europe-600-utilities-ucits-de-etf-DE000A0Q4R02
While U.S. companies grow dividends faster, Europe’s higher base yield and superior coverage ratios provide income stability. The iShares STOXX Europe 600 Utilities ETF exemplifies this, delivering a 2.88% yield with 84% payout consistency since 2010.
D.3. Total Return Analysis
When adjusting for currency and dividends, Europe’s long-term performance rivals U.S. markets:
€100,000 Invested in 2000
 and annualized return. The STOXX 600 shows a value of €324,700 and a 6.1% annualized return, while the S&P 500 shows €291,400 and a 5.4% annualized return. STOXX 600 figures are in blue text, S&P 500 in red.")
Sources:
https://curvo.eu/backtest/en/market-index/msci-europe?currency=eur
https://www.slickcharts.com/sp500/returns
This outperformance stems from:
Lower Drawdowns: Europe’s maximum 12-month loss since 2000 was -45% vs -51% for the S&P 500
Recovery Speed: Dividend reinvestment cut Europe’s 2008 crisis recovery time from 67 to 49 months
Sector Mix: Heavy weightings in stable dividend payers (25% of index vs 15% in U.S.)
Structural Drivers of Dividend Superiority
Europe’s dividend edge stems from deeply ingrained market features:
1. Shareholder Culture
73% of Euro Stoxx 600 firms have explicit dividend policies vs 54% of S&P 500
Legal frameworks in Germany/France mandate profit distribution thresholds
2. Sector Composition
Financials (19% of index) average 4.0% yield
Healthcare (13%) delivers 3.5% with 5-year CAGR of 6.2%
3. Tax Incentives
15% withholding tax rate EU-wide vs 30% for U.S. dividends to foreign investors
Risks and Mitigations
While compelling, Europe’s dividend story carries caveats:

In an era of heightened volatility (Trump’s Tariffs, the US-China Trade war, etc.) and lower return expectations, Europe’s dividends offers value investors a rare combination of income stability and compounding potential.
E. The Dream of a Unified Capital Market
Europe’s fragmented capital markets represent both a structural weakness and a monumental opportunity. While the U.S. benefits from deep, liquid markets that channel 75% of corporate funding through capital markets, Europe remains over-reliant on bank lending (75% of corporate financing vs. 26% in the U.S.) . This disparity costs the EU economy an estimated €535 billion annually in unrealized corporate funding potential. However, concerted efforts toward a Capital Markets Union (CMU) could fundamentally reshape Europe’s financial landscape.
E.1. Current fragmentation: regulatory, tax, listing issues
Europe’s capital market fragmentation manifests across multiple dimensions:
Regulatory Complexity
27 Different Insolvency Regimes: Recovery rates for creditors range from 35% in Greece to 92% in Finland, creating cross-border investment uncertainty.
Divergent Tax Policies: Withholding tax rates on dividends vary from 0% (UK) to 35% (Switzerland), complicating portfolio optimization.
Disparate Listing Requirements: IPO costs average 5.7% of capital raised in Germany vs. 3.2% in France, discouraging small-cap listings.
Market Infrastructure Gaps
Settlement Systems: The EU has 23 central securities depositories compared to 1 in the U.S., adding €2.8 billion annually in clearing costs.
Trading Liquidity: The average bid-ask spread for mid-cap stocks is 0.45% in Europe vs. 0.18% in the U.S., reflecting thinner markets.
, Equity Market Capitalization as a percentage of GDP (EU27: 68%, U.S.: 194%), and Venture Capital as a percentage of GDP (EU27: 0.08%, U.S.: 0.83%).")
Sources:
1. https://www.ecb.europa.eu/pub/pdf/scpops/ecb.op369~246a103ed8.en.pdf
2. https://9075c432-8d38-4fcf-8025-d4433c9ea618.usrfiles.com/ugd/9075c4_d4e0b78f4a84436eac941092de90246b.pdf
This fragmentation carries real economic costs. A 2021 Bruegel study found EU firms pay 1.5-2.0% higher borrowing costs than U.S. peers due to market inefficiencies. For a €500 million corporation, this translates to €7.5-10 million in annual excess interest expenses.
E.2. EU efforts toward Capital Markets Union
The CMU initiative, launched in 2015, aims to create a seamless pan-European capital market. Key milestones include:
1. Legislative Achievements (2019-2025)
Prospectus Regulation (2019): Reduced IPO documentation costs by 30% for cross-border listings.
Sustainable Finance Disclosure Regulation (2021): Channeled €672 billion into green bonds by standardizing ESG reporting.
European Single Access Point (ESAP): Launched in 2024, this centralized database provides real-time access to corporate filings across 27 jurisdictions.
2. 2020 Action Plan: 16 Measures to Accelerate Integration
The European Commission’s updated CMU strategy focuses on three pillars:
Green/Digital Transition Financing: Created €240 billion Sustainable Europe Investment Plan
Retail Investor Protection: Introduced pan-European pension product (PEPP) with €34 billion AUM by 2025
Market Infrastructure Reform: Launched T2-T2S consolidation project to unify securities settlement
3. Venture Capital Catalyst
The EU Venture Capital Fund-of-Funds program has mobilized €6.1 billion into European startups since 2021, helping close the funding gap with the U.S. where VC investments per GDP remain 10x higher.
E.3. Benefits of a Unified Market
Full CMU implementation could unleash transformative economic benefits:
Corporate Funding Boost
Equity Markets: EU market capitalization could grow by €7.8 trillion (114% increase), supporting 7,230 additional listed companies.
Venture Capital: Annual investments could rise by €11 billion, funding 4,800 high-growth firms currently starved of capital.
Bond Markets: Corporate bond issuance capacity may expand by €210 billion annually through standardized securitization frameworks.
Macroeconomic Impact
 implementation. The metrics are: Capital Market Depth/GDP (68% in 2025, 142% post-CMU), Cross-Border Equity Holdings (22% in 2025, 45% post-CMU), and Equity Turnover Ratio (54% in 2025, 82% post-CMU).")
Sources:
https://www.ecb.europa.eu/pub/pdf/scpops/ecb.op369~246a103ed8.en.pdf
https://9075c432-8d38-4fcf-8025-d4433c9ea618.usrfiles.com/ugd/9075c4_d4e0b78f4a84436eac941092de90246b.pdf
A 2023 European Parliament study estimates CMU completion could:
Add 1.5% to EU GDP (€240 billion annually)
Create 2.1 million jobs through improved SME access to growth capital
Reduce systemic risk by increasing private risk-sharing (target: 40% of shocks absorbed vs. current 25%)
The Road Ahead: Challenges and Catalysts
While political hurdles remain-particularly regarding tax harmonization and national sovereignty concerns-three catalysts are accelerating progress:
Green Transition Financing Needs: The EU requires €4.3 trillion in climate investments by 2030, necessitating deeper capital markets.
Geopolitical Shifts: 23% of EU firms are relocating supply chains from Asia, requiring €214 billion in domestic capital expenditure.
Demographic Pressures: With 21% of the EU population over 65 by 2030, pension funds need deeper markets to meet 4-6% return targets.
The CMU represents Europe’s best opportunity to escape the "bank-centric" model that has left its equity markets trading at a 30% P/E discount to the U.S. . For investors, successful implementation would create:
Enhanced Liquidity: Bid-ask spreads could narrow by 0.15-0.25 percentage points
Sector Diversification: Technology’s share of EU market cap could rise from 7% to 15%
Risk-Adjusted Returns: Sharpe ratios may improve by 0.3 points through better capital allocation
For value investors willing to look beyond short-term volatility, Europe’s integration offers one of the most compelling long-term value propositions in global markets, if it’s done correctly.
F. Comparing with the U.S. Market
The divergent trajectories of European and U.S. equity markets reflect structural differences in sector composition, monetary policy, and market integration. While the U.S. has dominated global equity flows since 2010, shifting macroeconomic conditions and geopolitical realignments are creating opportunities for European equities to close the gap. (This all depends on the EU’s execution of its own plans)
I have already compared the two markets a lot, so as to not repeat myself I will only be touching upon the tech dominance in the US vs EU market.
F.1. Performance gap explained: tech dominance in U.S., fragmentation in EU
The U.S. market’s outperformance stems largely from its tech sector concentration, which constitutes 31.5% of the S&P 500 compared to just 7% in the STOXX Europe 600. This tech premium has driven valuation multiples:

Sources:
1. https://seekingalpha.com/article/4740556-s-and-p-500-index-is-now-more-like-technology-sector-investment
2. https://stoxx.com/index/SX8P/?factsheet=true&d=2023-11
Europe’s fragmentation exacerbates this gap. The EU relies on bank loans for 75% of corporate funding versus 26% in the U.S., limiting growth capital access for innovative firms. This structural disparity costs European companies 1.5-2.0% higher borrowing costs than U.S. peers, as I have previously mentioned.
G. Risks to Consider
While European equities offer compelling opportunities, investors must carefully assess structural and cyclical risks that could negatively affect returns. I will try to cover the biggest risks.
G.1. Political fragmentation
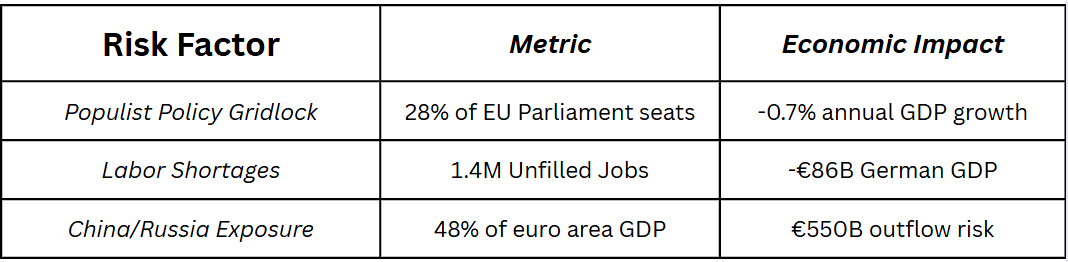
Europe’s political landscape has grown increasingly polarized, with right-wing populist parties gaining influence in key markets like Italy (19% of Euro Stoxx 600 GDP) and France (17%). The 2024 EU elections saw populist factions capture 28% of parliamentary seats, up from 21% in 2019. This shift introduces three key risks:
Policy Uncertainty: Populist coalitions often oppose EU integration efforts like the Capital Markets Union, which requires unanimous member state approval. Moody’s estimates political instability could delay CMU implementation by 2-3 years, costing €240 billion in unrealized corporate funding.
Labor Market Pressures: Anti-immigration policies threaten to exacerbate Europe’s 1.4 million worker shortage in critical sectors like healthcare and tech. Germany alone faces a €86 billion annual GDP gap from unfilled jobs.
Geopolitical Exposure: The euro area’s financial ties to geopolitically distant nations (China, Russia) reached 60% of GDP in 2020 before declining to 48% by 2021. A major conflict could trigger capital outflows exceeding €550 billion.
Data Snapshot:
G.2. Currency risks (EUR/USD exposure)
The euro’s depreciation against the dollar since 2021 has amplified losses for U.S. investors. Key dynamics to monitor:
Interest Rate Divergence: The ECB’s 2.4% rate trails the Fed’s 4.5%, maintaining downward pressure on EUR/USD.
Hedging Costs: 1-month forward contracts cost 0.8% annually to hedge euro exposure.
Return Impact: Unhedged European equities underperformed hedged versions by 59 percentage points from 2015-2025.
EUR/USD Sensitivity Analysis

G.3. Slower innovation in tech sectors
Europe’s tech sector remains undersized (7% of market cap vs. 31% in U.S.) due to chronic underinvestment:
R&D Spending: EU firms allocate 2.2% of GDP to R&D vs. 3.5% in the U.S..
Patent Growth: European Patent Office filings grew just 0.3% in 2024 versus 5.1% for Asian applicants.
VC Funding: European startups raise €0.08 per GDP vs. €0.83 in the U.S., a 10x gap.
Sector Comparison

While exceptions like ASML (€35 billion R&D spend since 2020) exist, Europe lacks scaled tech ecosystems. The EU’s AI investment (€12 billion) trails U.S. ($47 billion) and China ($31 billion) by wide margins.
Risk Mitigation Strategies

Europe’s equity risks are real but manageable. By combining hedging, sector rotation, and fundamental analysis, you can mitigate the downside exposure.
H. Final thoughts: Rethinking European Equities
H.1. Summary of key strengths
European equities offer a compelling value proposition anchored by attractive valuations (14x forward P/E vs. 20.5x in the U.S.), superior dividend yields (3.7% vs. 1.3%), and sector diversification across industrials, luxury goods, and green energy. Structural reforms like the Capital Markets Union could unlock €1.4 trillion in corporate funding potential, while reshoring trends are driving €214 billion in domestic industrial investment.
H.2. Why Europe might be undervalued in global portfolios
Despite representing 15% of global market capitalization, European equities account for just 8% of average global equity allocations. This underweight ignores:
Currency-adjusted returns: Hedged European ETFs outperformed U.S. equivalents by 59% from 2015-2025
Risk-adjusted metrics: European small caps show a Sharpe ratio of 0.72 vs. 0.58 for U.S. peers
Geopolitical hedge: 48% lower China exposure than U.S. indices
H.3. Final thoughts: not a U.S. replacement, but a solid diversification play
Europe shouldn’t replace U.S. equities but rather complement them:
Low correlation: 0.76 10-year correlation with S&P 500
Cyclical balance: 32% weight to defensive sectors (vs. 22% in U.S.)
Monetary policy tailwinds: ECB rates projected at 1.65% by 2025 vs. 3.5% Fed funds rate
H.4. 🇪🇺 List of top ETFs for European exposure
1. Broad Market Exposure
iShares Core MSCI Europe ETF (IEUR): 0.09% expense ratio, 6.5% YTD return (2025), 2.95% dividend yield. Tracks 450 large/mid-cap stocks across 15 countries.
SPDR EURO STOXX 50 ETF (FEZ): 0.29% fee, 4.5% YTD gain. Focuses on eurozone blue-chips like ASML and LVMH.
2. Country-Specific Plays
iShares MSCI Germany ETF (EWG): 0.50% expense, 19% YTD return. Leverages Germany’s industrial resurgence with 58% allocation to DAX® constituents.
3. Sector Opportunities
EURO STOXX® Banks 30-15 ETFs: 41.6% YTD return (2025), 4.0% yield. Capitalizes on ECB rate cuts and CMU-driven financial integration.
Mirae Asset Defence Tech ETF: 37% YTD gain. Benefits from NATO’s 2% GDP defense spending targets.
4. Factor Strategies
iShares Edge MSCI Europe Momentum Factor ETF: 12.9% 2024 return. Targets high-momentum stocks like Siemens Energy (+326% in 2024).
I. Conclusion
Europe’s equity markets present a compelling mix of undervaluation and structural potential. Despite challenges like political fragmentation, the region’s attractive valuations, sectoral strengths in industrials and green energy, and ongoing reforms through the Capital Markets Union offer upside. For global investors, European equities serve as a diversification tool. While not a U.S. replacement, strategic allocation (5-15% of portfolios) provides higher risk-adjusted returns.